|
||
|
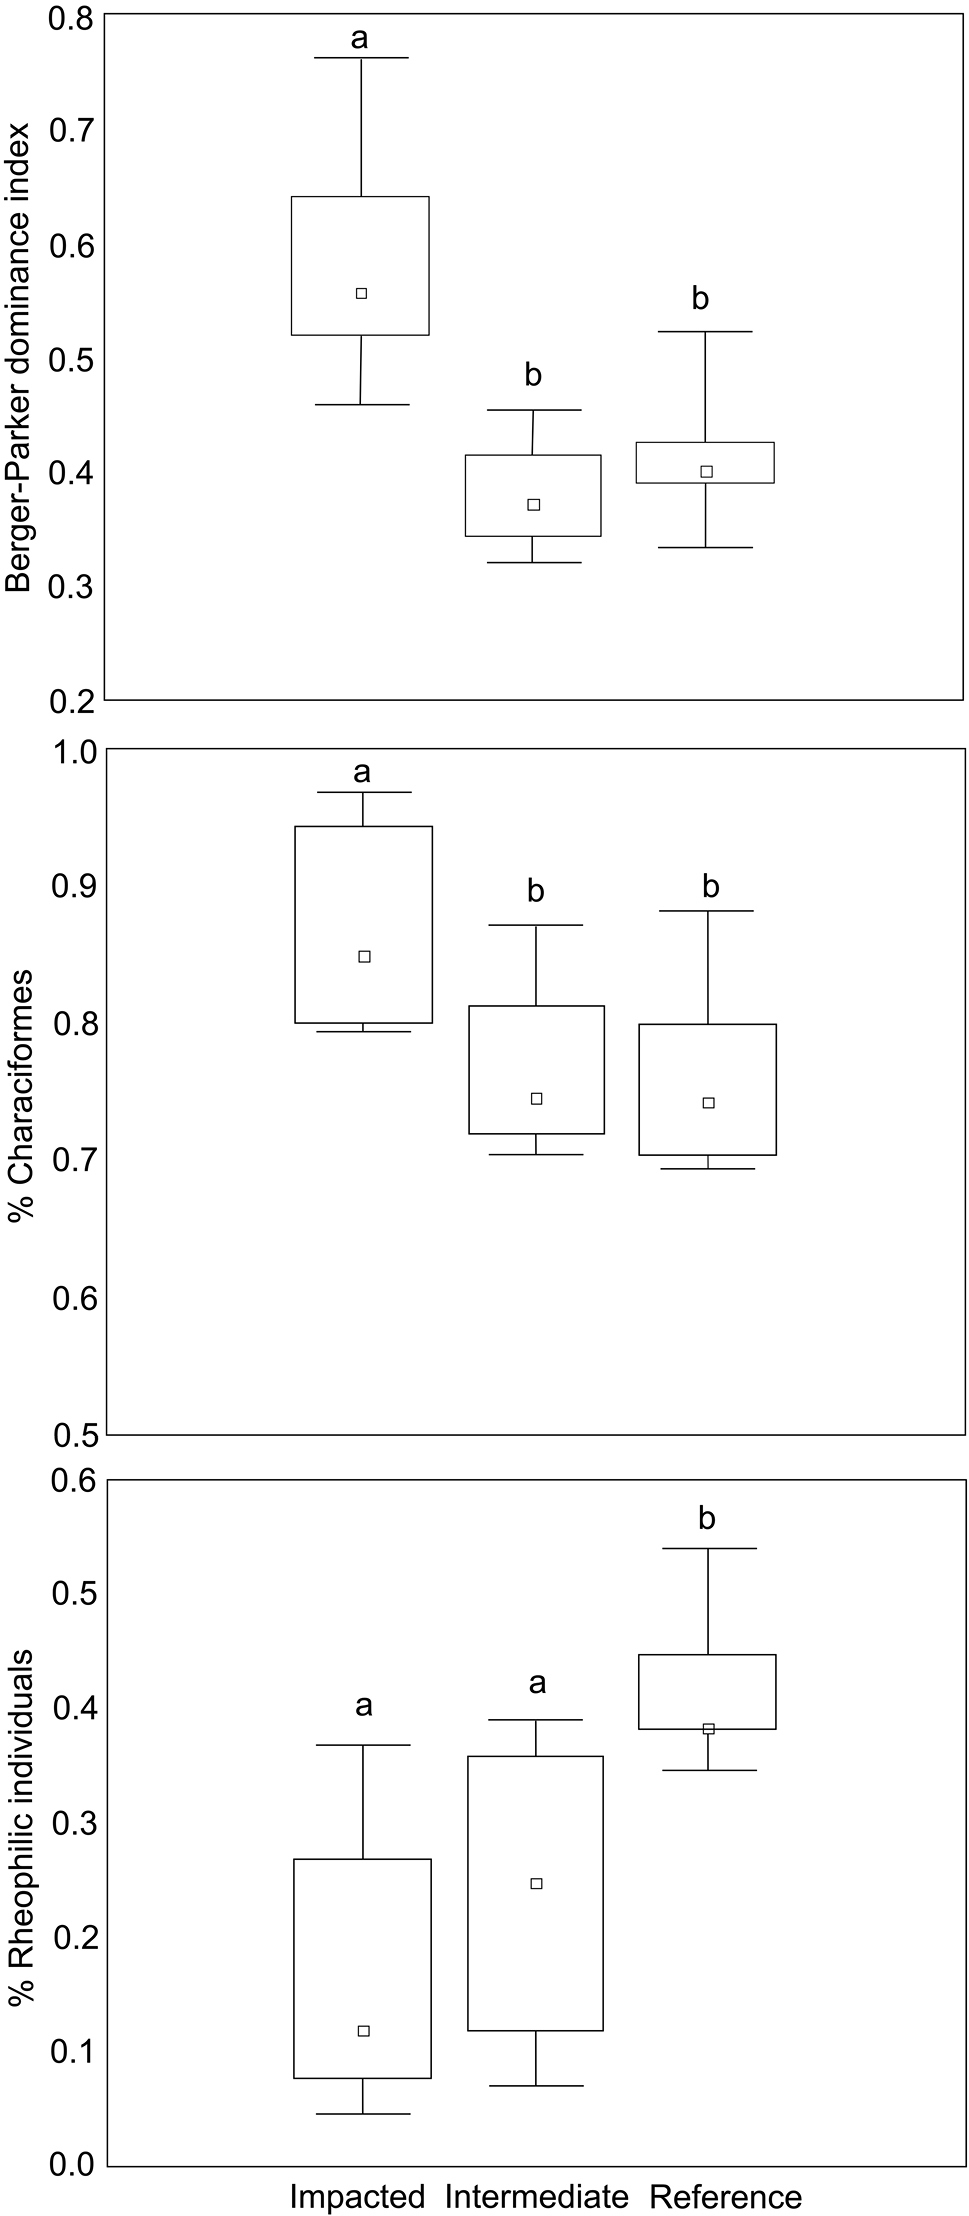
Box-and-Whisker plots of the three sensitive metrics. Rectangles represent the 1st and 3rd quartiles, small squares are medians, bars are maximum and minimum values. Different letters indicate statistically significant differences. |
|
||||||||
| Part of: Ávila MP, Carvalho RN, Casatti L, Simião-Ferreira J, de Morais LF, Teresa FB (2018) Metrics derived from fish assemblages as indicators of environmental degradation in Cerrado streams. Zoologia 35: 1-8. https://doi.org/10.3897/zoologia.35.e12895 |