|
||
|
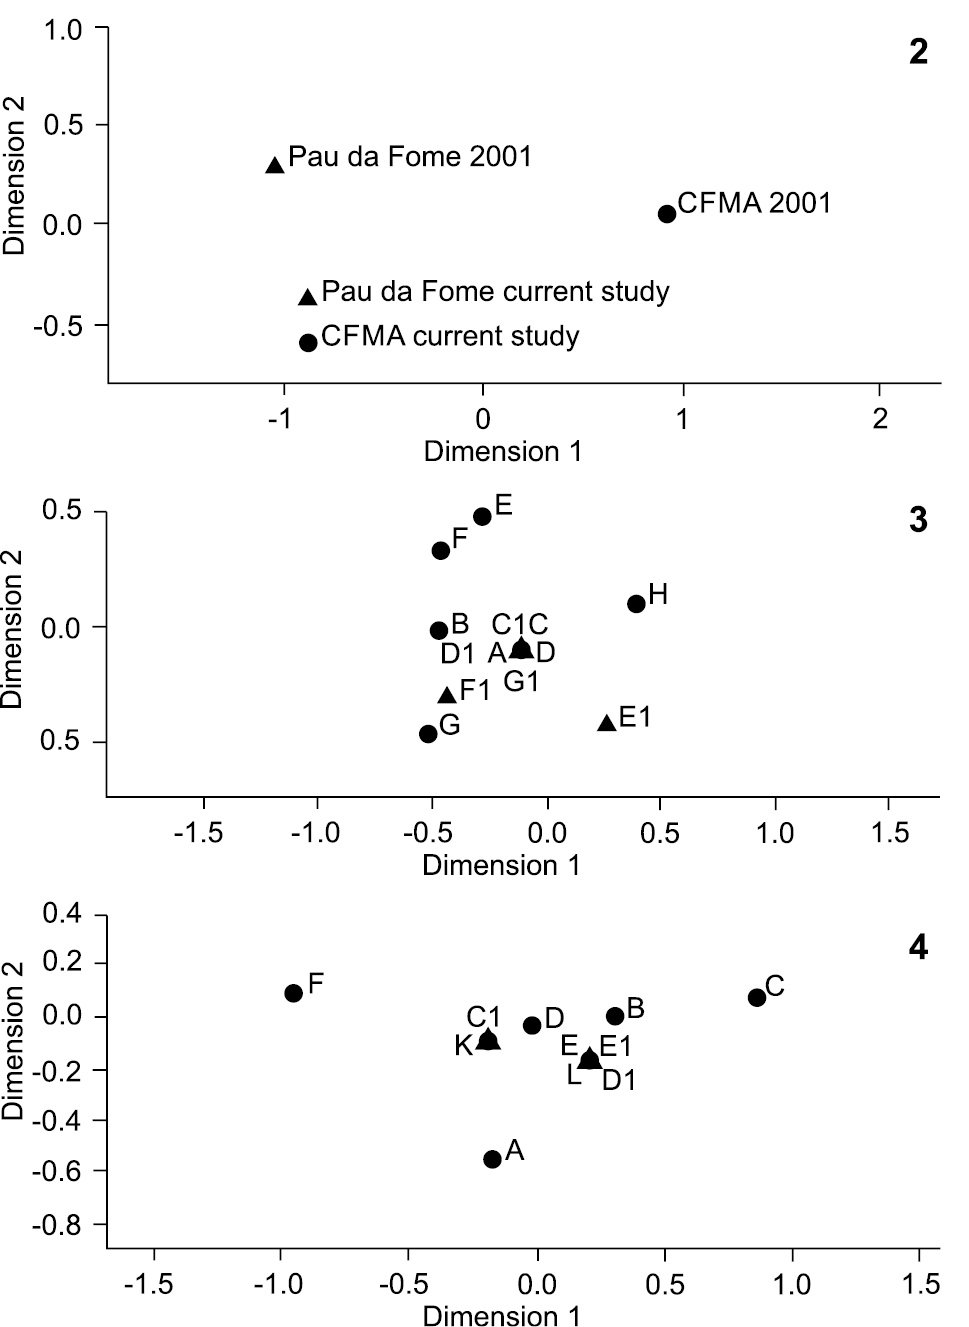
Plots of the Non-metric Multidimensional Scaling Analysis between the two periods and areas studied (● CFMA and ▲ Pau da Fome) for the small mammal species: (2) comparison between 2001 and 2012-2015 samplings including all transects pulled; (3) comparison among transects in 2001(transects from A to D in disturbed forests and from E to H in peridomicile areas of CFMA; transects from C1 to G1 in disturbed forest of Pau da Fome); (4) comparison among transects for the 2012-2015 period (transects A, B, K, L in disturbed forest areas of CFMA; E1 in disturbed forest areas of Pau da Fome; C, D in peridomicile areas of CFMA; C1 and D1 in peridomicile areas of Pau da Fome; E and F in preserved forest areas of CFMA). |