|
||
|
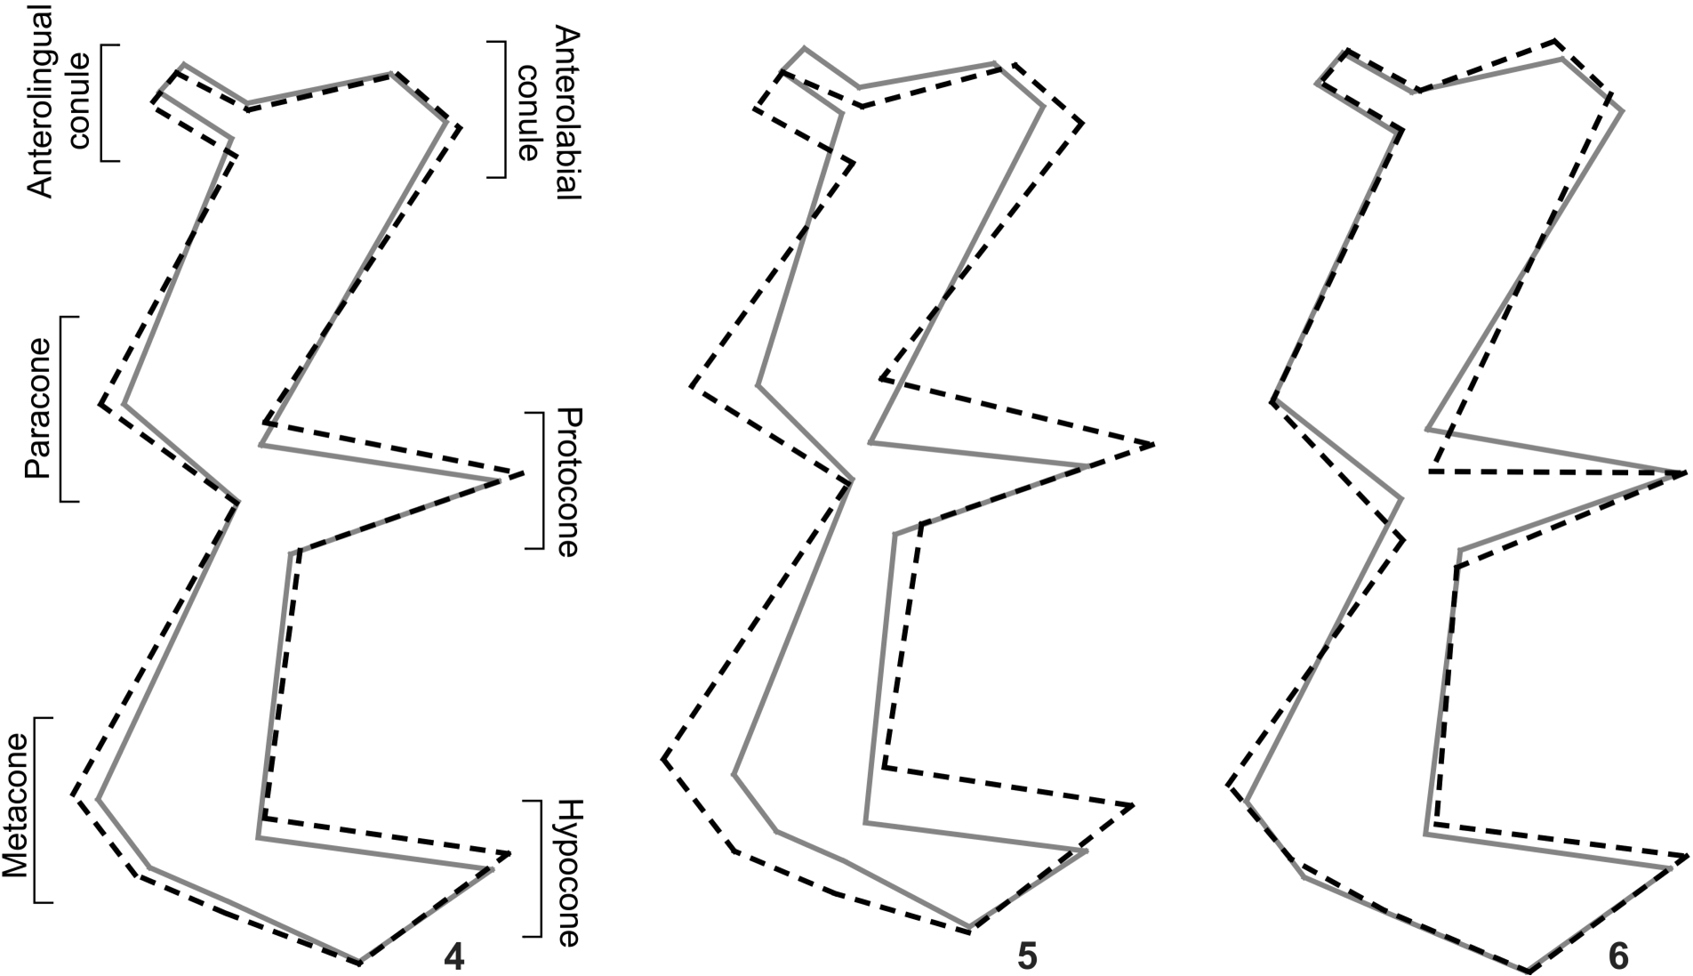
Shape differences wireframes in PC1. Gray solid lines indicate C. tener (positive PC1 values) and black dotted lines indicate C. expulsus (negative PC1 values), see Fig. 3 for individual projections. (4) Differences between the mean shapes of C. tener and C. expulsus; (5) differences between the disparate shape of C. tener represented by CT 05 and C. expulsus represented by CE 09; (6) shape differences wireframes in PC2. Gray solid lines indicate the mean of shape of PC2 value and black dotted lines indicate specimen CT 02 (C. tener outlier). |