|
||
|
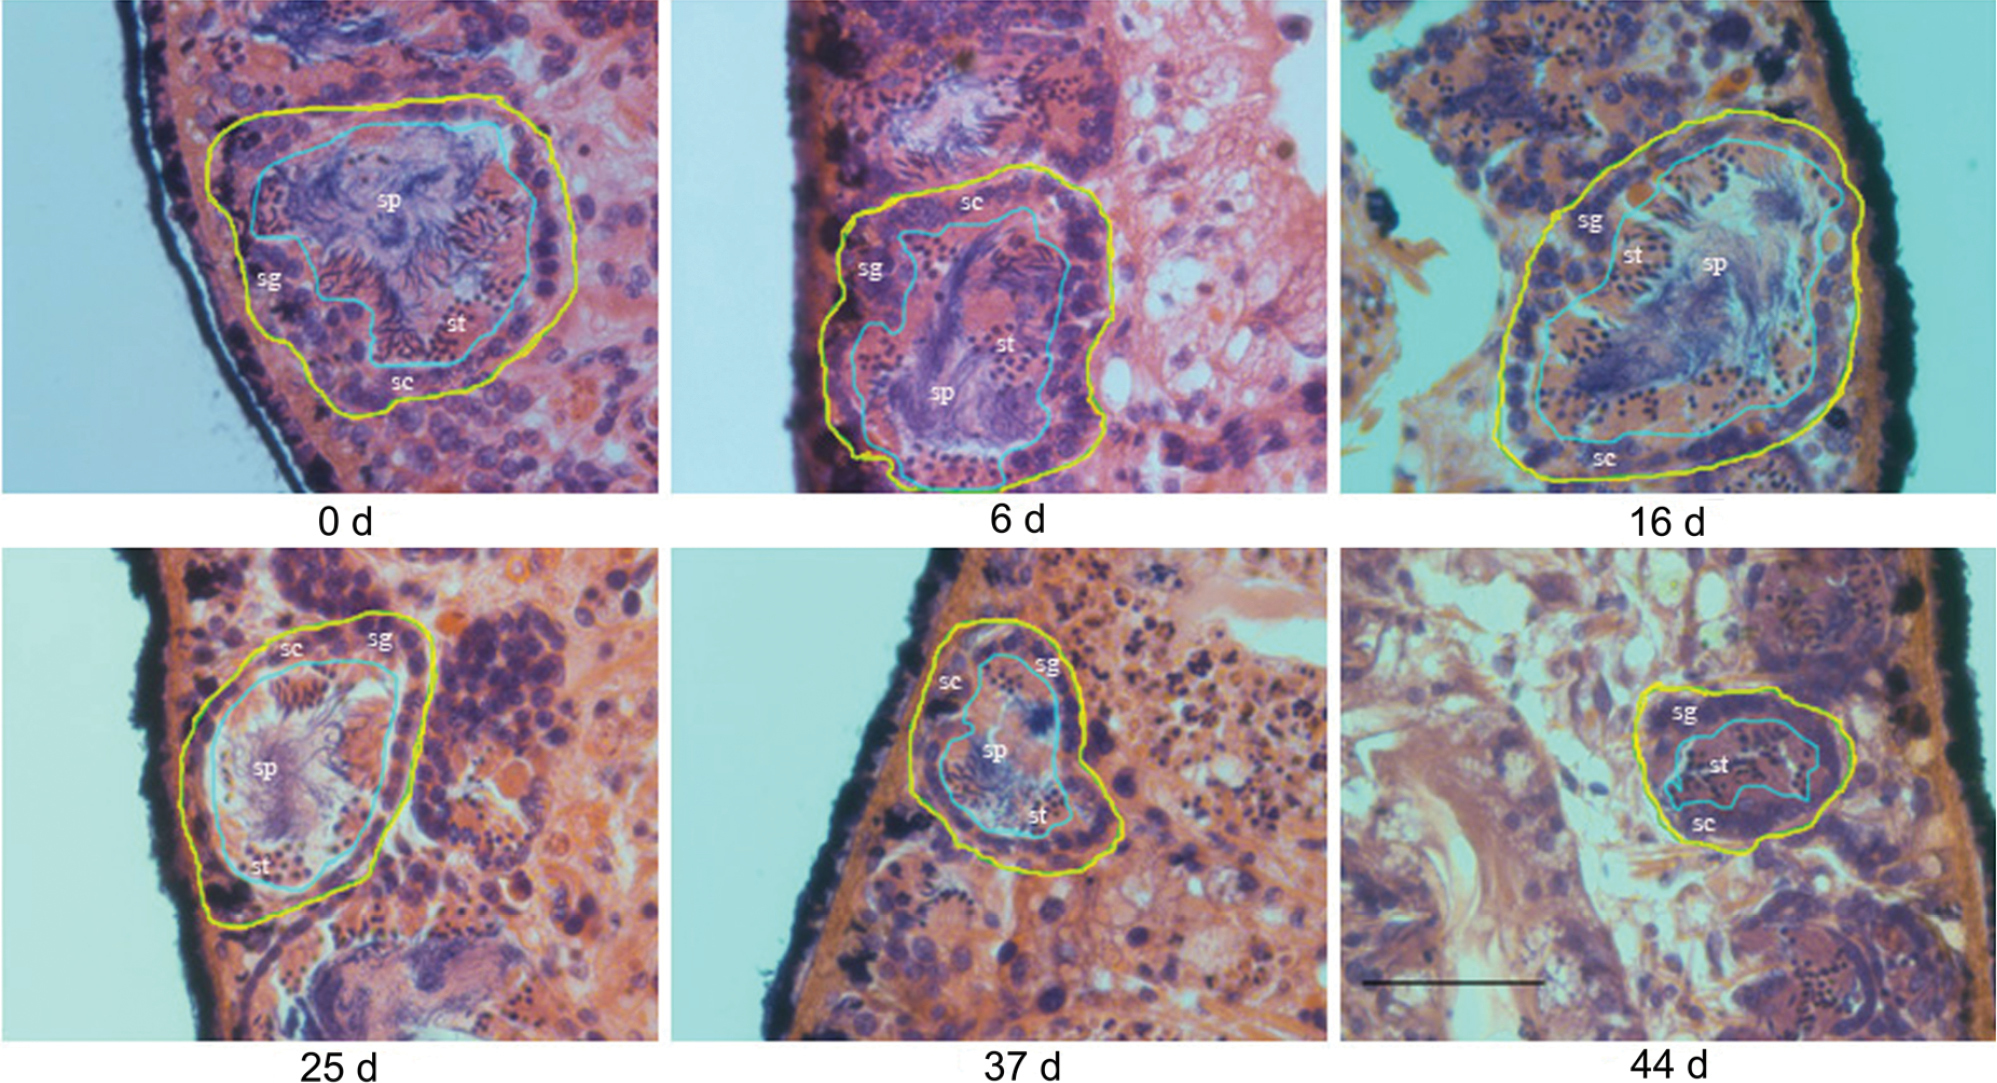
Sagittal section of testis during starvation. The blue lines indicate the innermost region and the yellow lines indicate that the border between the testis region and the surrounding tissue. d: days after starvation, sg: spermatogonium, sc: spermatocyte, st: spermatid, sp: spermatozoa. Scale bar: 100 μm. |