|
||
|
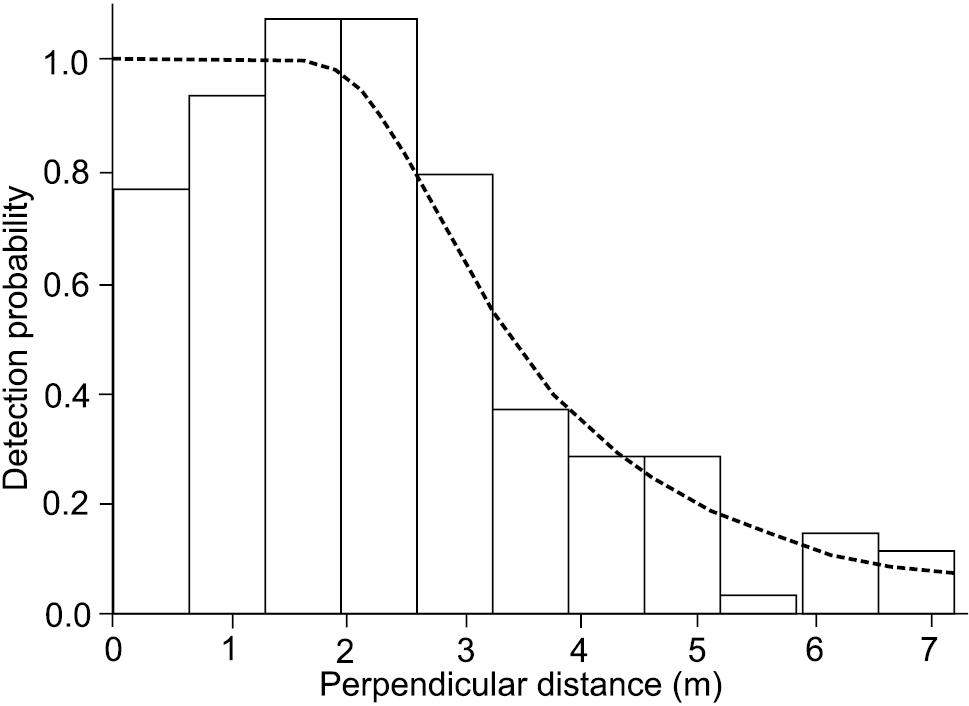
Plot of the detection function for spotted pacas based on the AIC selected Conventional Distance Sampling (CDS) model. Histogram represents the probability of detection for each distance interval. The curved line is the detection function, showing the probability that a spotted paca is observed as a function of distance from the transect line. |