|
||
|
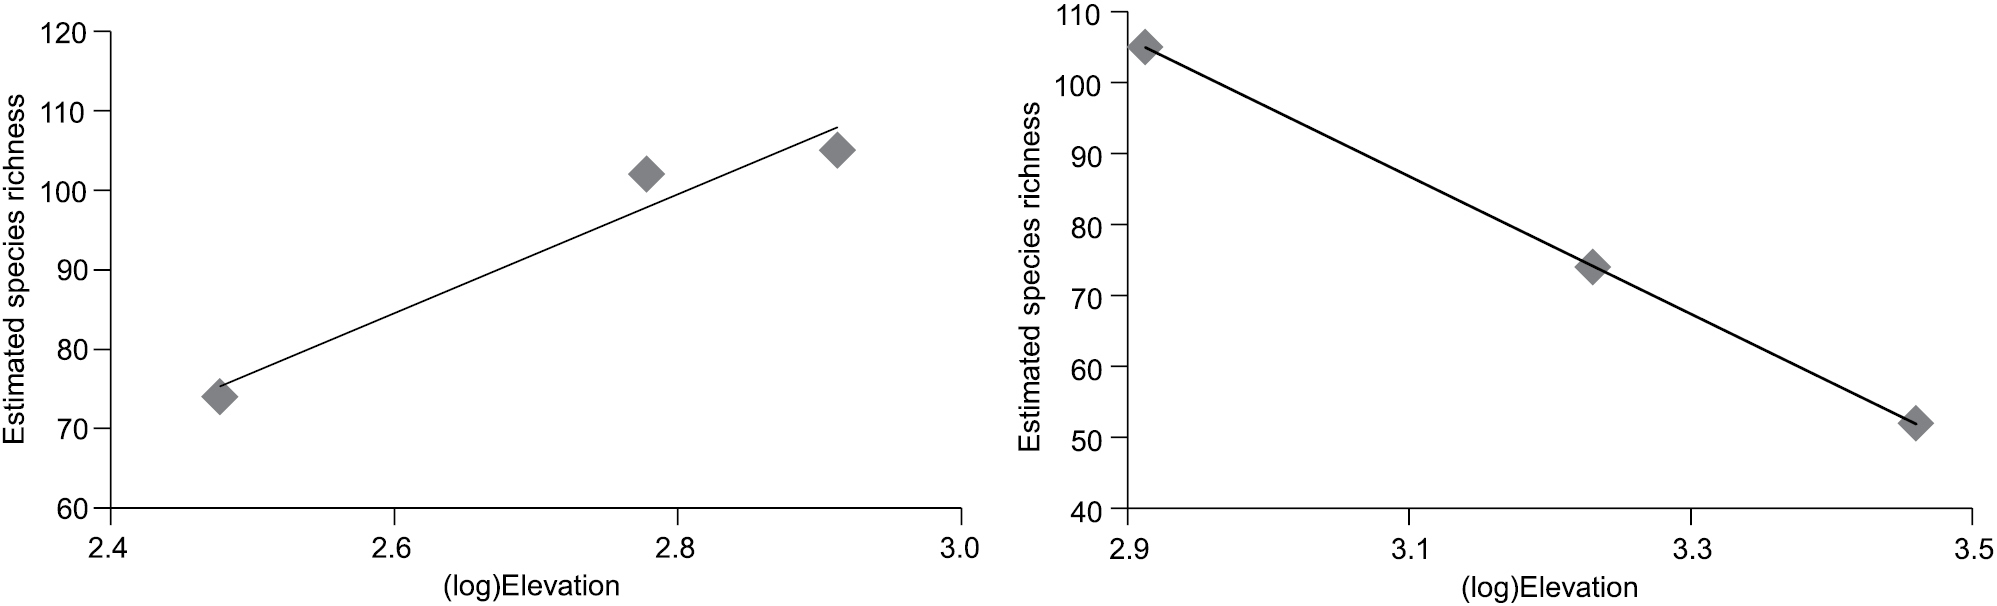
Breakpoint regression analysis for (log)elevation with estimated species richness. Vitobamba (800 m), which was the break point, is included in both graphs. The characteristic mid-elevation unimodal richness pattern can be seen with the increase in species richness with elevation up to Vitobamba (r2 = 0.953, p = 0.139), and the decrease in species richness with elevation above Vitobamba (r2 = 0.999, p = 0.003). |