|
||
|
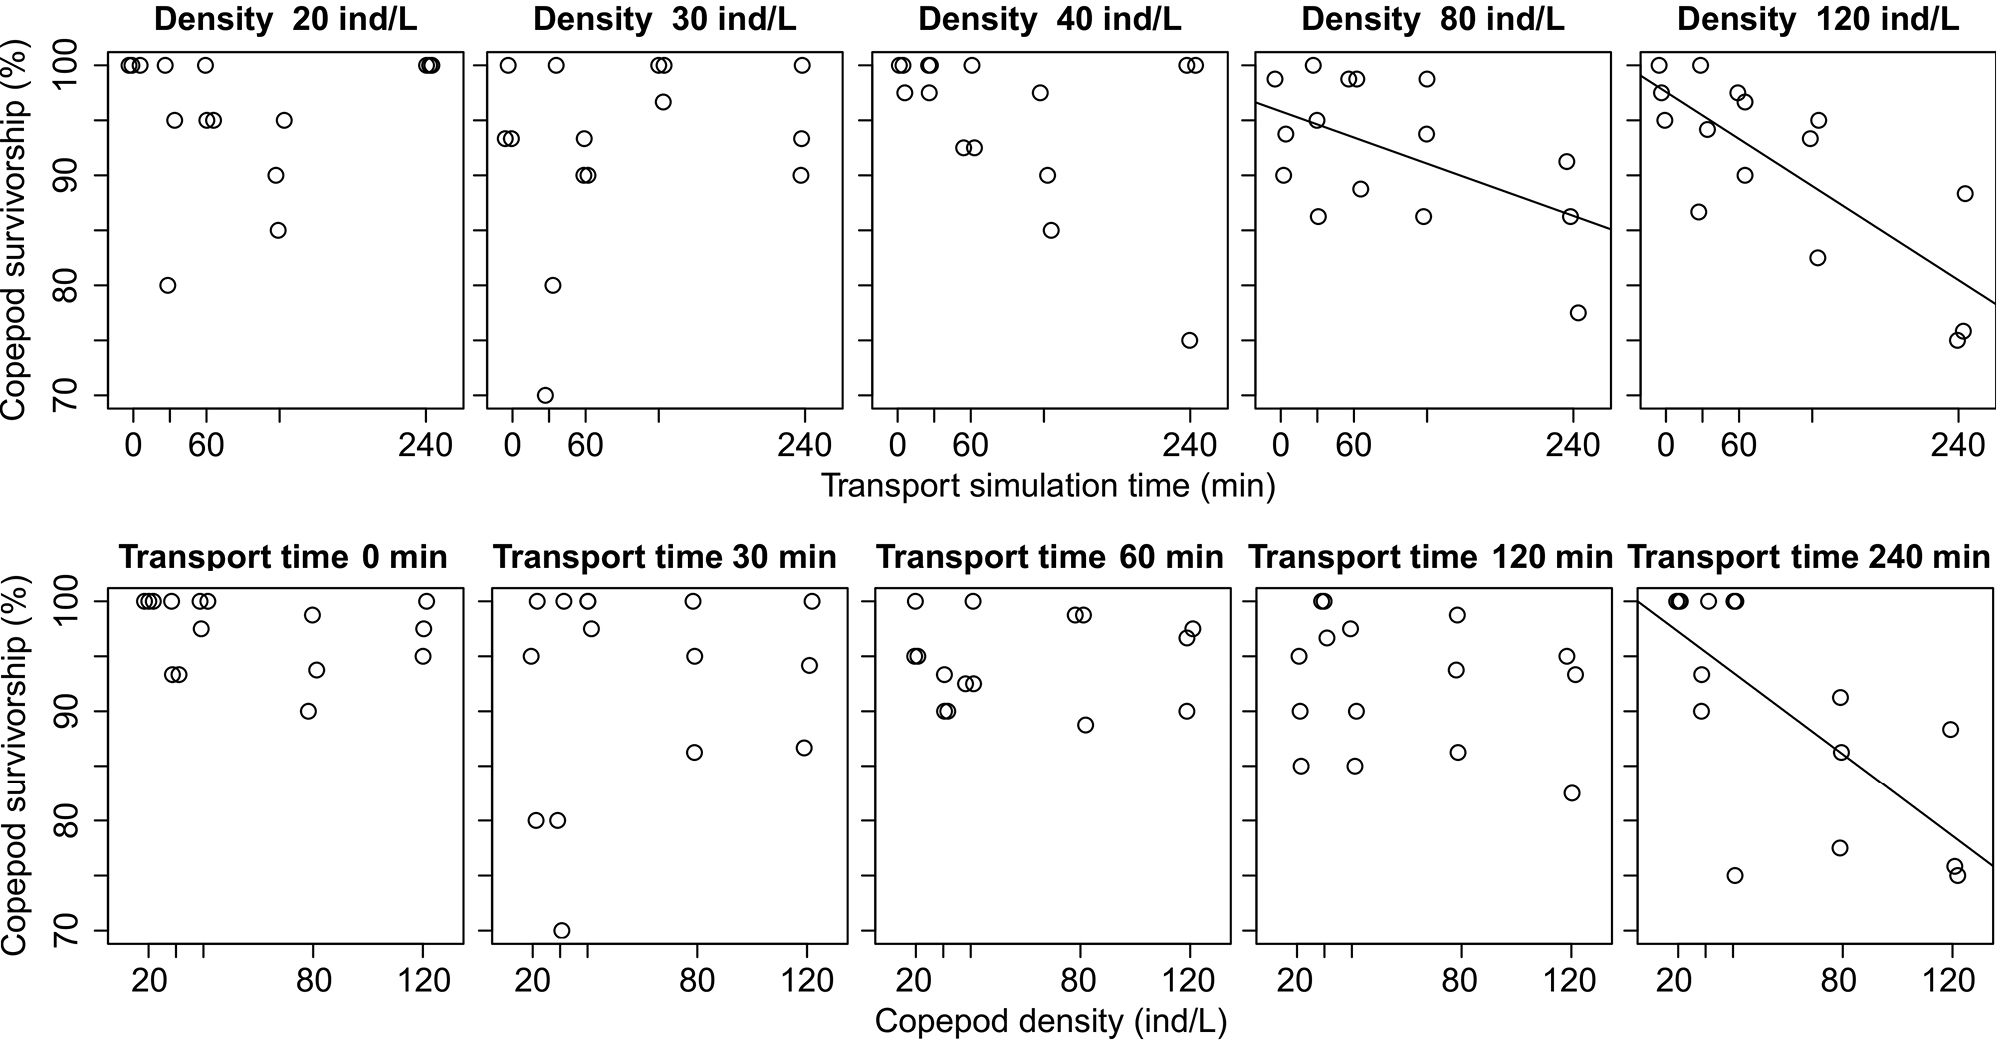
The dots represent the observations and the lines the linear regression models for significant correlations. The first row of graphs demonstrates the effect of transport time over copepod survival separately for different loading densities and the second demonstrates the effect of the loading density over the copepod survival, separately for different transport durations. Significant correlations: Density 80 ind.L-1 – Model: Copepod survival = 95.81 - 0.039*transport time (p-value = 0.038, Adjusted R2 = 0.23); Density 120 ind.L-1 – Model: Copepod survival = 97.58 - 0.071*transport time (p-value = > 0.001, Adjusted R2 = 0.57); Transport time 240 min – Model: Copepod survival = 100.97 - 0.186*copepod density (p-value = 0.0003, Adjusted R2 = 0.46). |