|
||
|
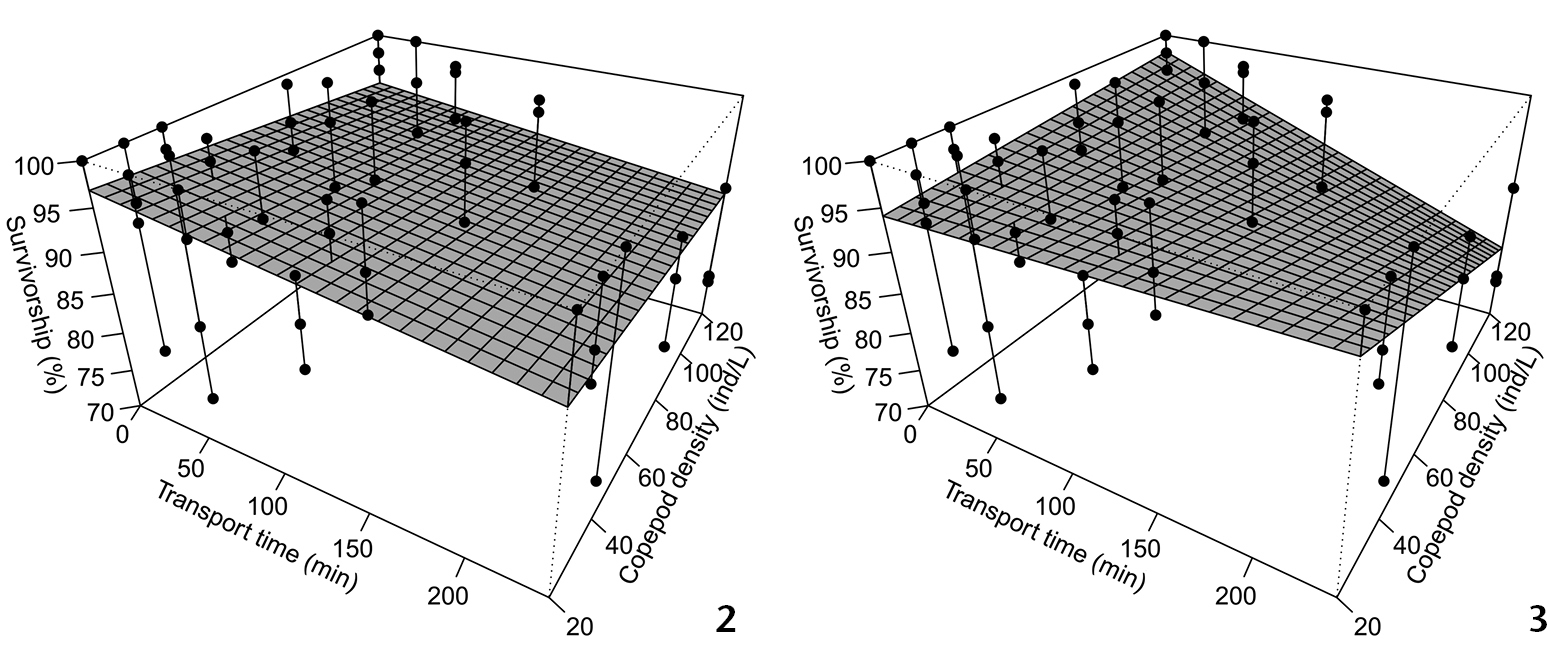
The dots indicate the observations and the surface plot the multiple linear regression models not considering (2) and considering (3) the interaction between explanatory variables. Models: (2) Copepod survivorship = 97.65 - 0.023*transport time - 0.03*copepod density (p-value = 0.015, Adjusted R2 = 0.084); (3) Copepod survivorship = 93.40 + 0.024*transport time + 0.035*copepod density - 0.0008*transport time*copepod density (p-value = > 0.001, Adjusted R2 = 0.20). |